Archiving 20 gigabytes per second—and making it usable
Archiving data at this rate is challenging and so is data preservation—making sure the information can be used for decades to come.
Scaling storage capacity well into the future
The 20-gigabytes-per-second requirement only takes into account First Plasma. Magnetic diagnostics will produce even more data after First Plasma and other systems, including bolometers, will add significantly to the total amount. Whatever decisions are made today have to work well into the future, scaling up to the ever-increasing storage needs.
All of the data will be stored in the Scientific Data and Computing Center, which is scheduled to be operational in 2024. The ITER group responsible for meeting the archiving and retrieval requirements—the Data, Connectivity & Software Section—has begun the process of choosing a file system that can swallow at least 20 gigabytes per second, with an architecture that scales beyond that. Working with colleagues in the Information Technology Division, the team is testing IBM's Spectrum Scale, a high-performance clustered file system that allows parallel access to several nodes in a cluster.
"Over the next six months we will host a few IBM experts to make sure we can archive 20 gigabytes per second, and access it simultaneously using data visualization tools," says Lana Abadie, Data Service and Visualization Engineer. "Reading and writing at the same time puts a tremendous load on a file system."
One of the challenges is storing complex data structures. The data is heavily nested and its format is highly variable from one case to another. For example, data from magnetic diagnostics will be structured in completely different ways from data originating from heating systems.
In addition to finding the right file system, the team needs to make sure the operating system and all applications involved can handle the volume. "We need to profile our software and hardware to find out where the bottlenecks are, and then tune those parts to speed them up," says Abadie. "We look to companies like Google, Netflix and Facebook for inspiration. We also follow the HPC (high-performance computing) community to see what works for them."
One tool the team relies on is the extended Berkeley Packet Filter (eBPF), which identifies weak links in the data flow within the Linux kernel. Another is Darshan, used by the HPC community to study the input and output behaviours of applications.
Not only does information have to be stored and preserved, but it also needs to be curated. There will certainly be some mistakes, which need to be spotted and corrected to avoid skews. For example, if the time synchronization is not working on a sensor, all the archived data from that sensor will have the wrong timestamps. Even with a robust time synchronization network in place, the archiving tools will add markers to some of the files to enable a comparison between the time in the server file and the sensor file—just to be sure.
High-volume retrieval for meaningful analysis
The second part of the challenge is making the data accessible for analysis. In some cases, trends will be computed and stored in aggregate form. But for deeper dives, scientists will need to see all the data. Access times need to be quick—a second or two in the worst case, rather than hours.
"Not only do you need to access all the data, but you also need to consider concurrency," says Abadie. "When you have one person accessing the data, it's not the same as having thousands of people. For First Plasma we estimate as many as 1,000 concurrent users."
To make the load more manageable, the team came up with a design that partitions the file system based on predicted usage patterns. Just as they profile and tune the tools that store the data, they also profile and tune the software and hardware that reads it back. To assist in analysis, Abadie and colleagues are acquiring and developing a number of applications to allow scientists to visualize and plot data.
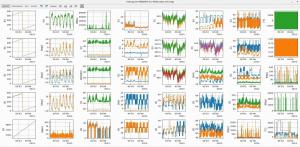
"We developed a data visualization tool with diagnostics colleagues and gave it the name MINT, for Make Informative and Nice Trends," says Abadie. "This tool will help scientists and engineers analyze physics parameters."
Furthermore, the team will release software libraries to help researchers build their own analysis tools. Using a common software technique called "encapsulation," the outer structure of the library will stay the same, hiding the specifics of the underlying software as it evolves over the decades to come. Developers using encapsulated libraries do not have to be concerned with the changes underneath.
"The sheer volume of data is what makes our work most challenging," says Abadie. "We try to provide the tools that make it easier for scientists and engineers to make sense of it all."


